DevInt operator documentation
DevInt answers five questions about your Linux servers, on one screen: what is running, are they healthy, are all services functional, am I vulnerable to CVEs, and is anything outdated — plus uptime probes against the endpoints you expose.
How it fits together
A tiny read-only agent on each node collects a full bill-of-materials and pushes it over mutual TLS to the control plane, which normalizes, deduplicates, enriches with CVE data, and answers fleet-wide questions through the console you are reading the docs for.
┌──────────────┐   mTLS push   ┌───────────────┐   ┌──────────────────────────┐
│  Edge agents │ ────────────► │ Ingest /       │──►│ Query / Intelligence     │
│ (Linux/K8s)  │  BOM deltas   │ normalize+CVE  │   │ (graph + search + store) │
└──────────────┘               └───────────────┘   └───────────┬──────────────┘
                                                     The Console (this UI) ◄─┘
Onboarding a node
Connecting a node takes three steps. The whole exchange is automatic after you paste one command.
1 · Mint an enrolment token
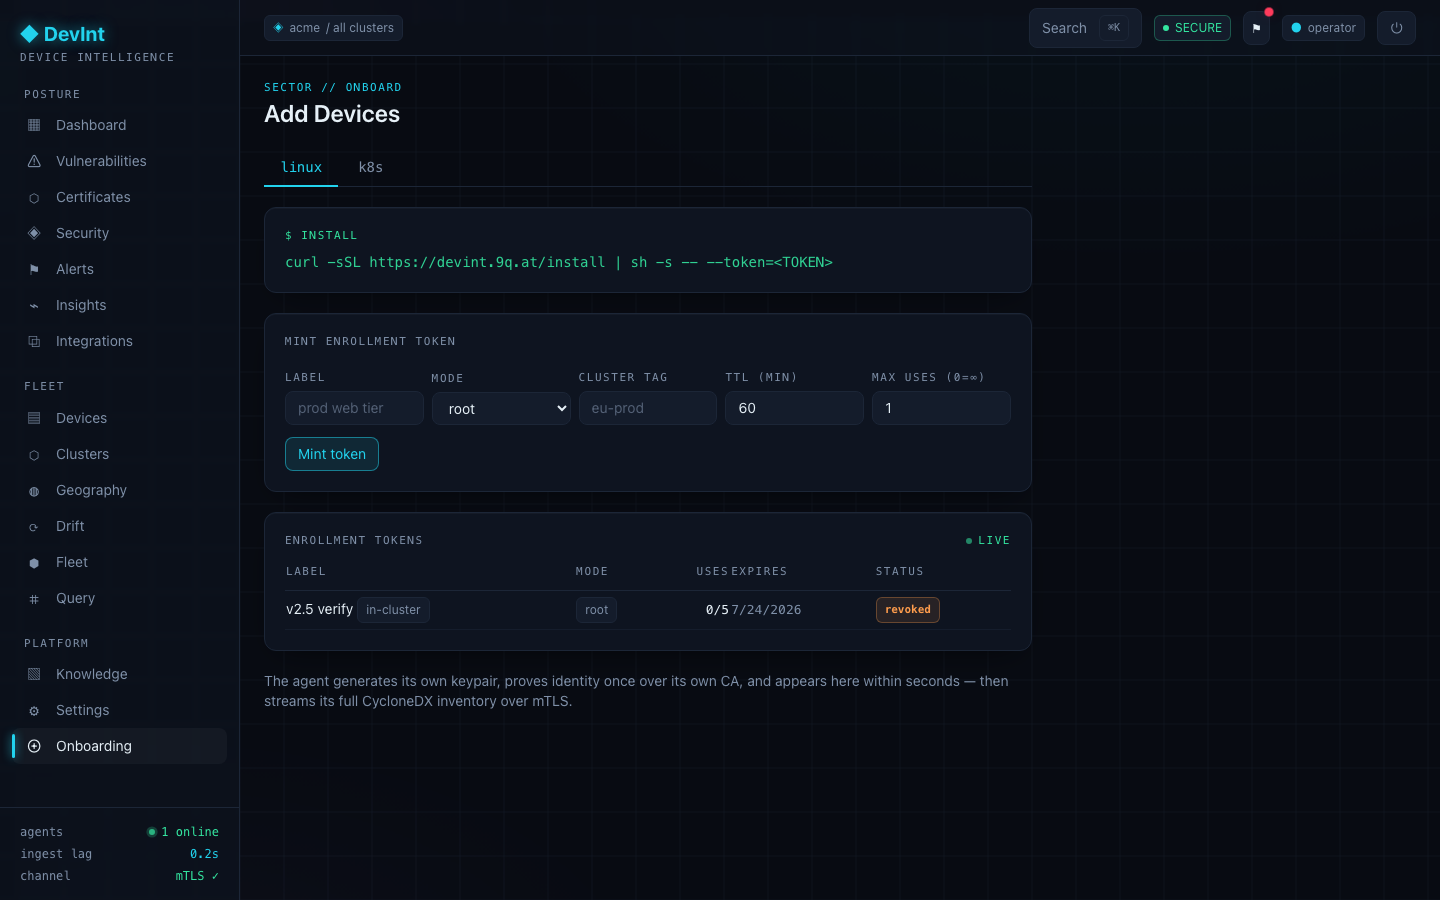
In the console, open Onboarding (under Platform). Fill in a label, choose the agent privilege mode, optionally a cluster tag, a time-to-live (default 1 hour), and how many nodes the token may enroll (max uses — set 0 for unlimited-until-expiry to bulk-enroll a fleet). Click Mint token and copy the value — it is shown once.
2 · Run the install command on the node
The console shows the exact command with your token substituted in.
# Linux host
curl -fsSL https://<your-console>/install.sh | sudo sh -s -- --token=<TOKEN>

# Kubernetes (in-cluster agent)
helm install devint oci://<your-instance>/chart --set token=<TOKEN>
The agent generates its own keypair, sends a certificate signing request plus the token, and receives an mTLS client certificate whose identity carries its assigned node_id and your org_id.
3 · Watch it appear
Within seconds the node shows up under Devices and begins streaming its full CycloneDX inventory. A re-enrolled node is reconciled by its stable machine-id, so re-installs never create duplicates.
Every screen, explained
Each console screen below: what you see, the possible values, and how to read them.
Dashboard
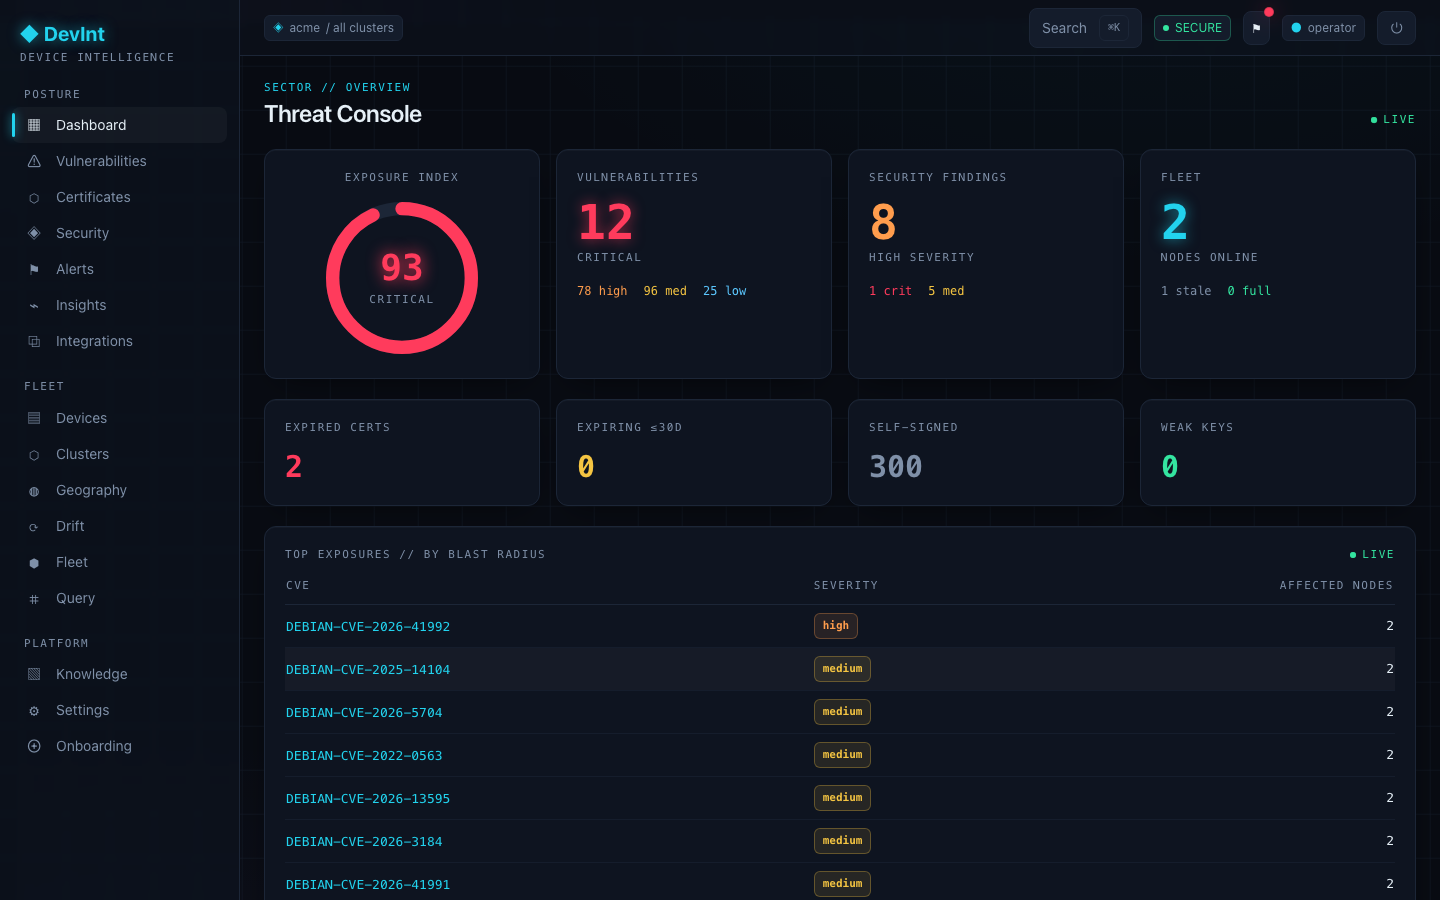
The at-a-glance posture of your whole fleet: node count and coverage, the CVE severity rollup, open security findings, and recent activity.
| Tile | Values | How to interpret |
|---|---|---|
| Fleet total / stale | counts | Stale = not seen in 15 min. A rising stale count means agents stopped reporting — check connectivity before trusting the rest. |
| Coverage | full / partial | Partial means a collector ran degraded (e.g. missing capability). Findings are still honest but incomplete for that node. |
| CVE rollup | critical / high / medium / low | Distinct CVEs affecting the org, counted once. Critical is your triage queue; click through to Vulnerabilities. |
Devices
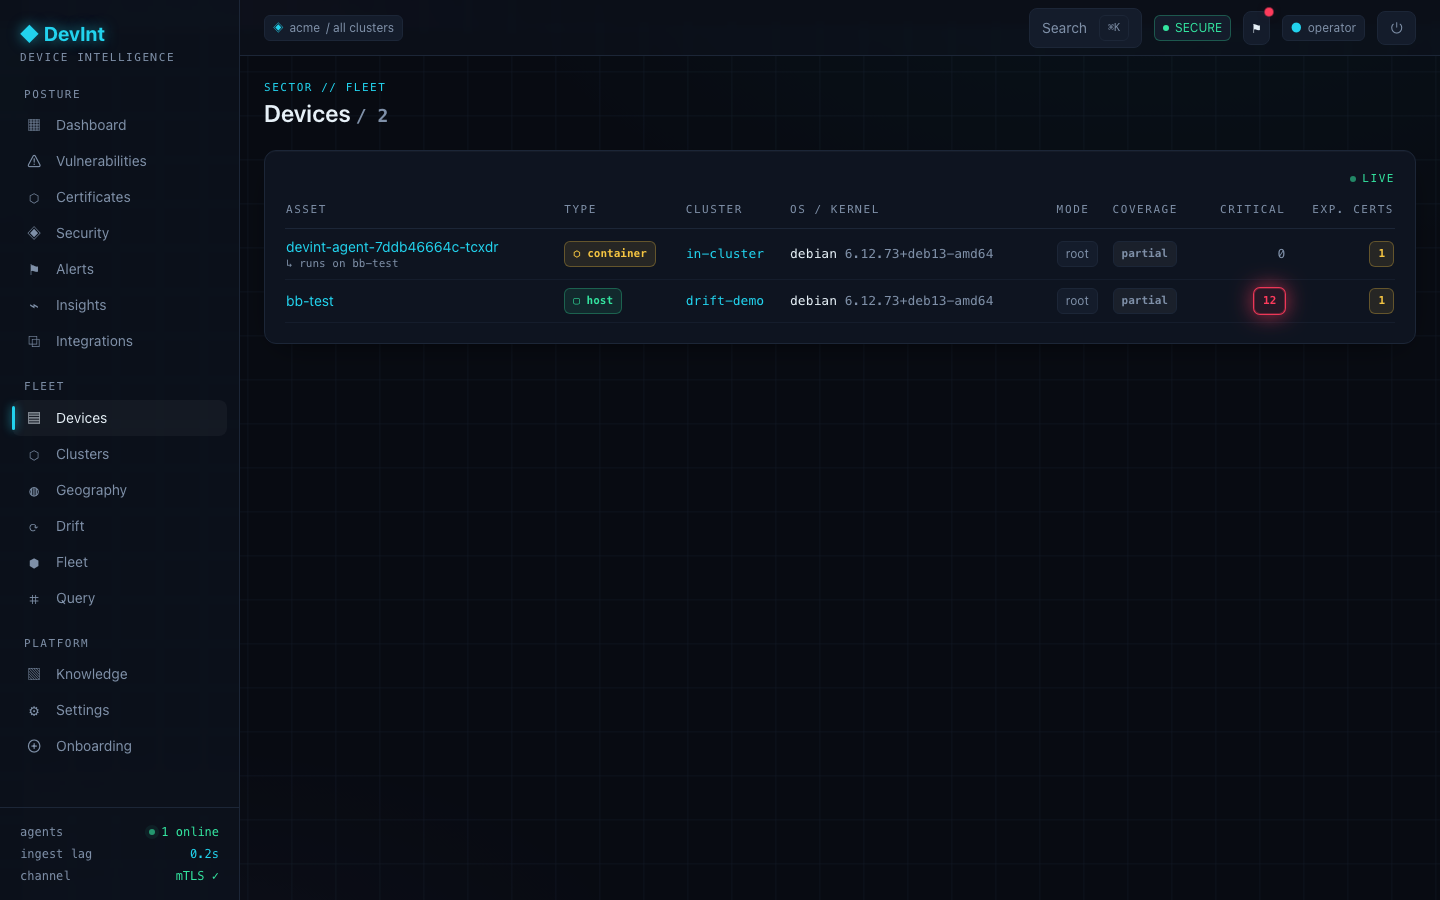
The fleet inventory — every node, host or container. This is the entry point to per-node detail.
| Column | Values | How to interpret |
|---|---|---|
| Type | ▢ host / ⬡ container | A host is a bare OS; a container is a pod that inventories its own image and the cluster it watches. Containers link to the host they run on (a container-escape foothold). |
| Cluster | link / — | The cluster this node serves. Click it to see cluster-wide findings. |
| Mode | root / least_priv | The agent's privilege. least_priv nodes report partial coverage for collectors that need root. |
| Critical / Exp. certs | counts | Open critical CVEs and expired certificates on that node — the two fastest signals of risk. |
Device detail
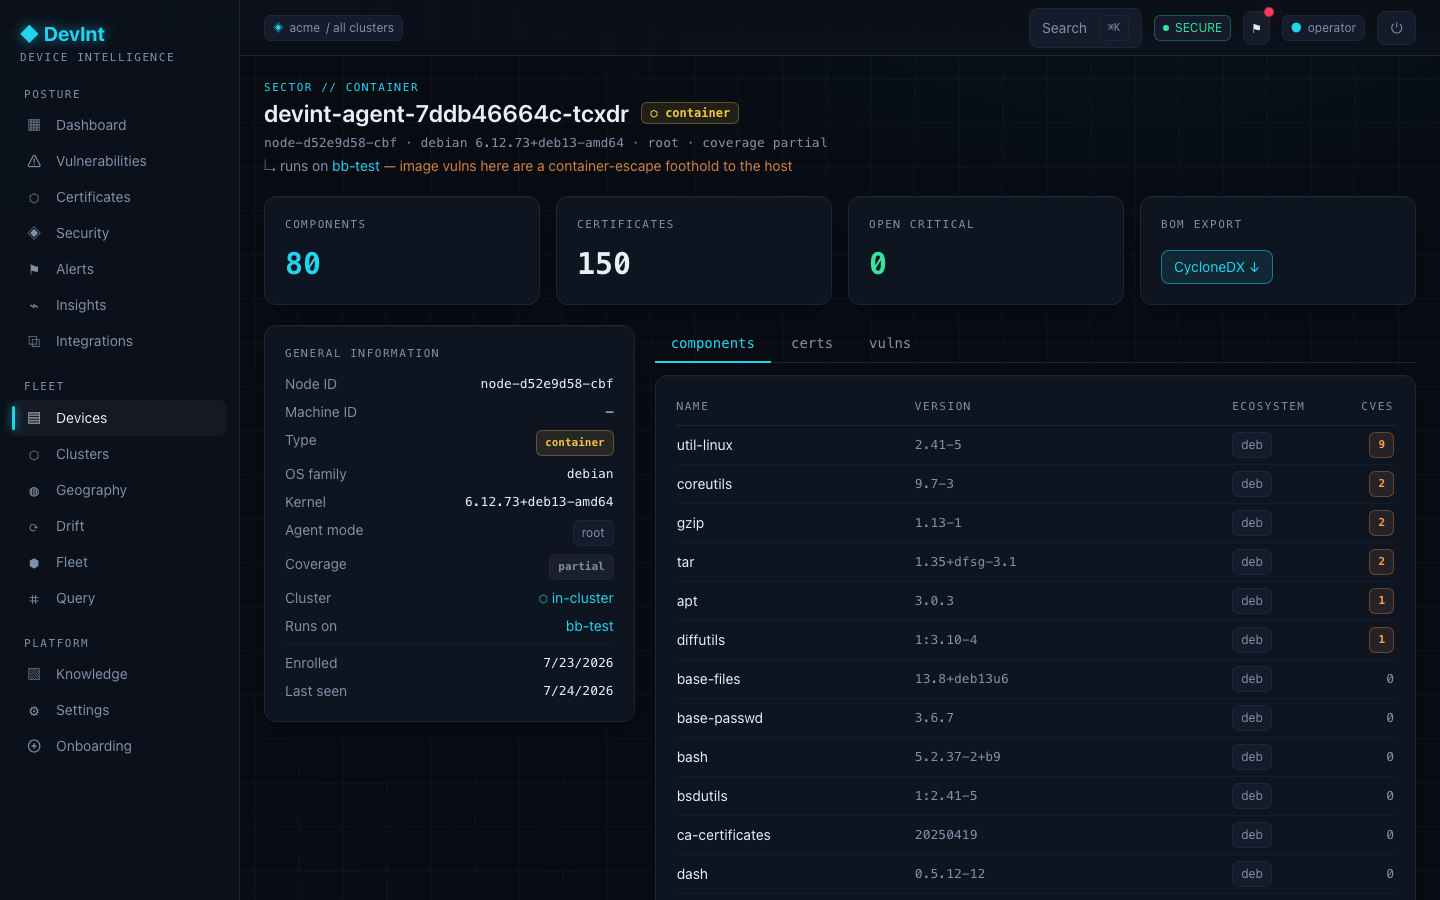
Click any device to open it. The left panel is the node's general information; the tabs on the right hold its components, certificates, and vulnerabilities.
General information (left)
Node ID and machine-id, type, OS family and kernel, agent mode, coverage, the cluster it serves, the host it runs on, and enrolled / last-seen timestamps. This is the node's identity and provenance at a glance.
Tabs (right)
- components — every package and dependency with its ecosystem and CVE count. Sorted worst-first.
- certs — certificates found on the node; an expiry in the past is shown in critical red.
- vulns — CVEs affecting this node, with severity, CVSS, and the offending component. Only exploitable (VEX-affected) CVEs appear.
The CycloneDX ↓ button exports the node's full bill-of-materials verbatim.
Component detail (drill-down)
Click any component to open it fleet-wide: its ecosystem and versions, the CVEs affecting it, and every node that carries it — so "which machines have this package" is one click, not a query.
Vulnerabilities
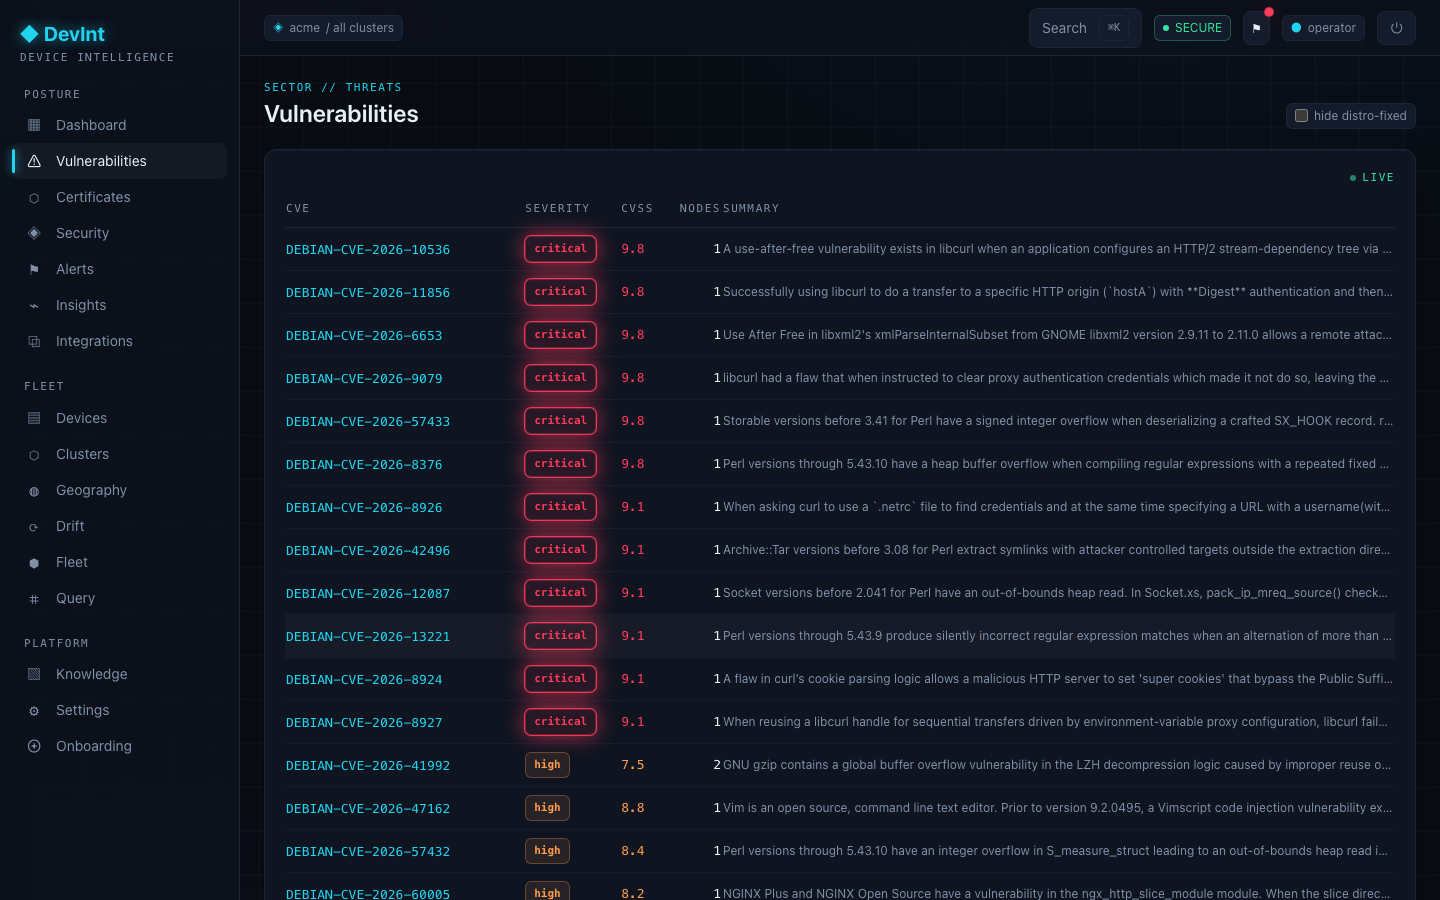
The fleet-wide CVE view. Each row is a distinct CVE with its severity, CVSS, whether it is a known-exploited vulnerability, and how many nodes it affects.
| Field | Values | How to interpret |
|---|---|---|
| Severity | critical / high / medium / low | From CVSS. Combine with KEV and affected-node count to prioritize. |
| KEV | flag | On CISA's Known-Exploited-Vulnerabilities list — actively exploited in the wild. Treat as top priority regardless of CVSS. |
| VEX state | affected / not affected / fixed | DevInt separates present from exploitable: a scary upstream version may already carry a backported distro fix. Only affected rows are real exposure. |
xz 5.2.5-1ubuntu may already be patched. DevInt orders versions and checks fixed-ness separately, so it suppresses false positives instead of alarming on the raw version string.CVE detail (drill-down)
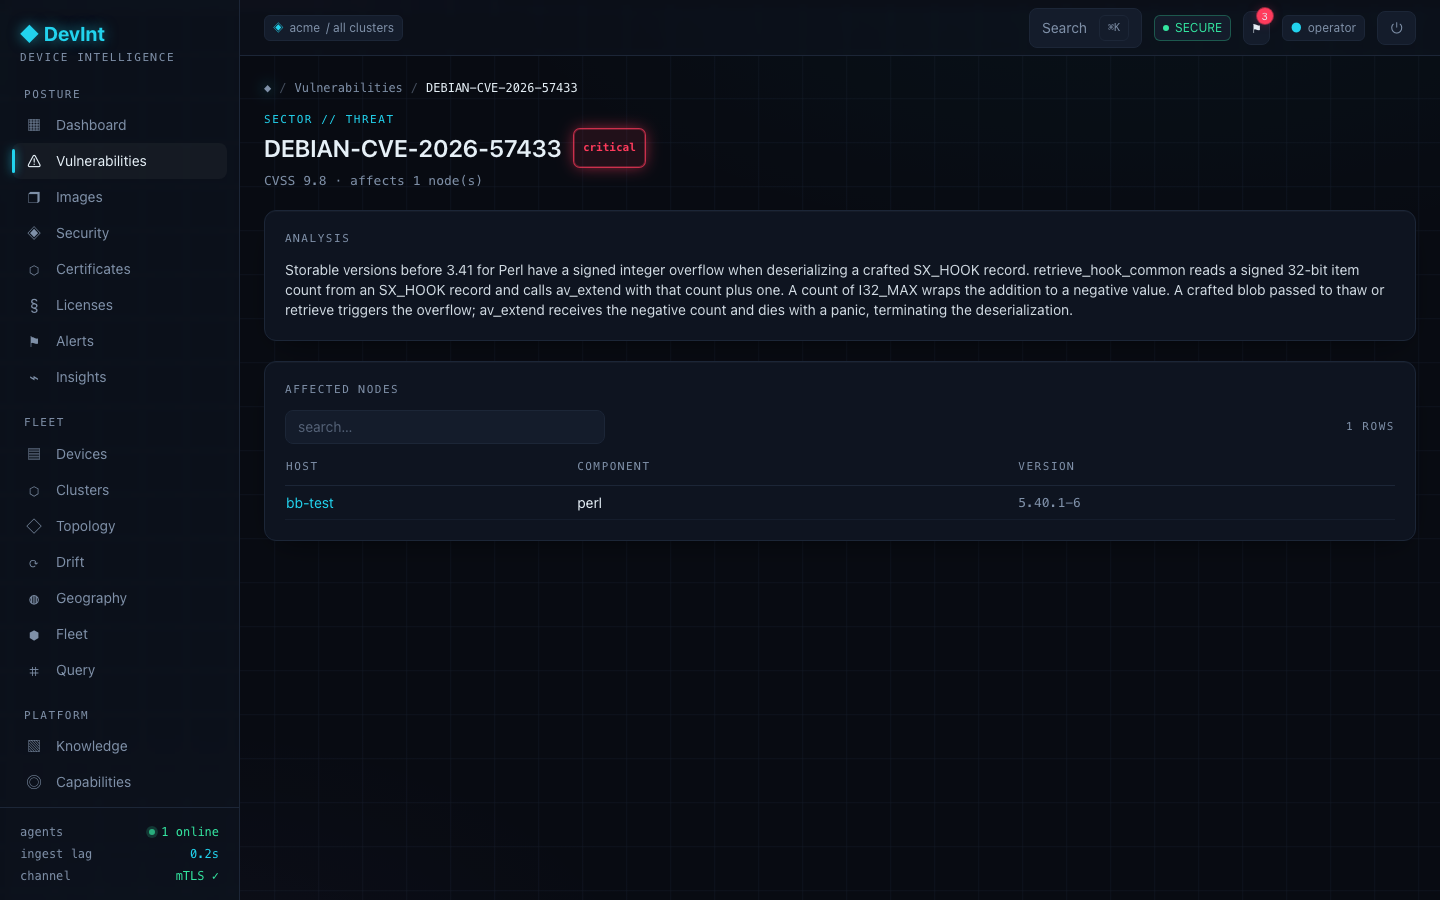
Open a CVE for its description, CVSS vector, KEV status, the affected component(s), and every node it touches — the pivot from "a CVE exists" to "here is exactly where, and whether it is exploitable."
Images
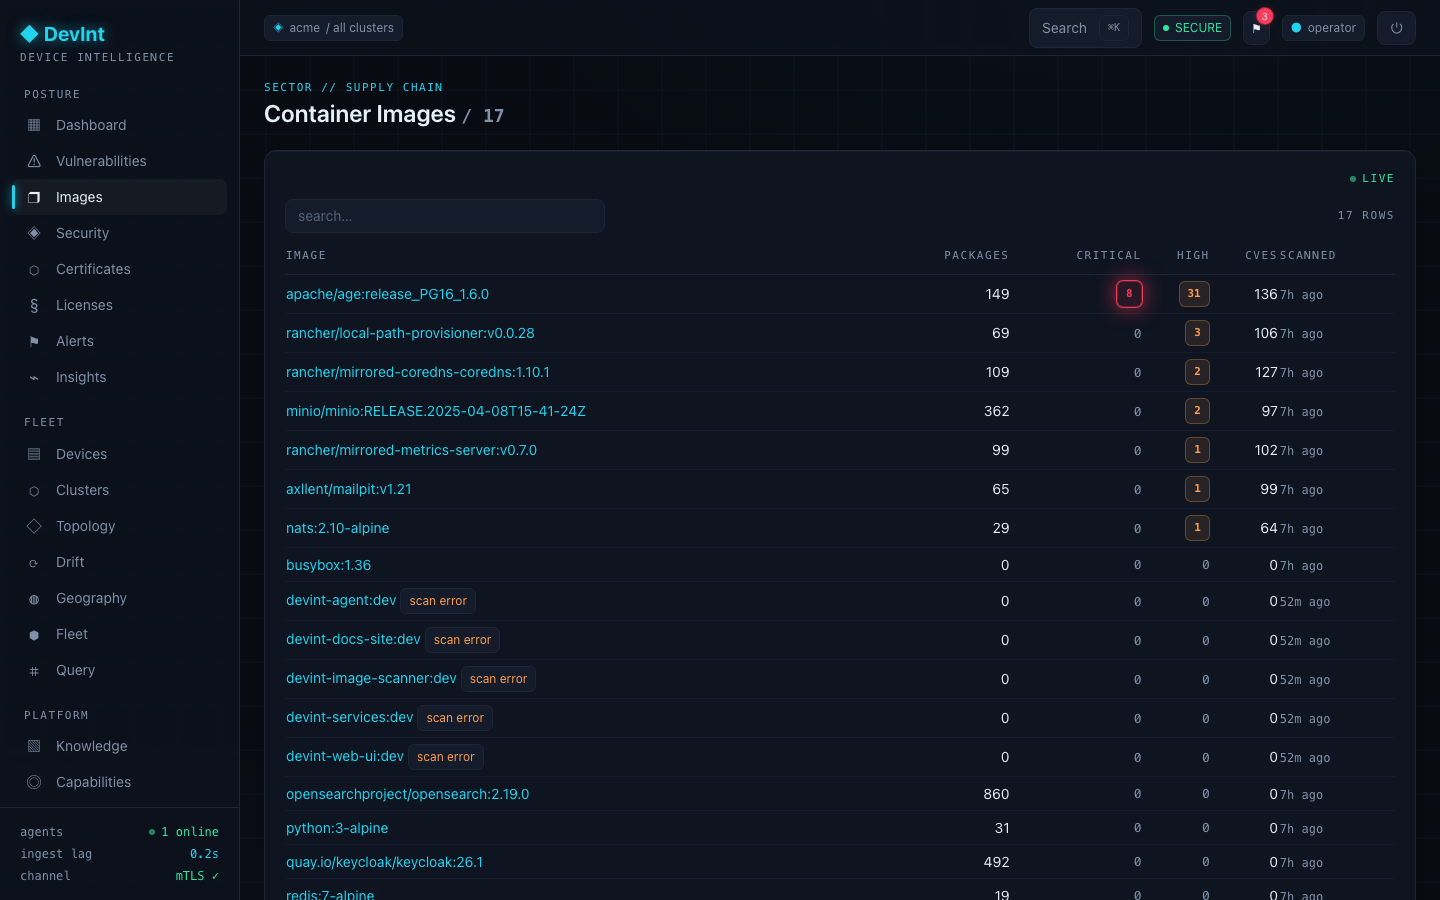
Container images running across your clusters, scanned as first-class assets. Every distinct image observed in a cluster is pulled apart into its own package inventory (via Trivy) and matched against the same CVE pipeline as hosts — so a vulnerable base image is visible fleet-wide, not hidden inside a pod.
| Field | Values | How to interpret |
|---|---|---|
| Ref | repo:tag | The image reference as it runs in a pod. Pinning to a digest is safer than a moving tag. |
| Packages | count | OS and language packages the scanner found inside the image layers. |
| Critical / High | counts | Distinct CVEs in the image by severity. A high count on a widely-run base image is fleet-wide risk. |
| Last scanned | time / error | When Trivy last analysed it. A scan error (an image it couldn't pull) is shown, so a blind spot never hides silently. |
Image detail (drill-down)
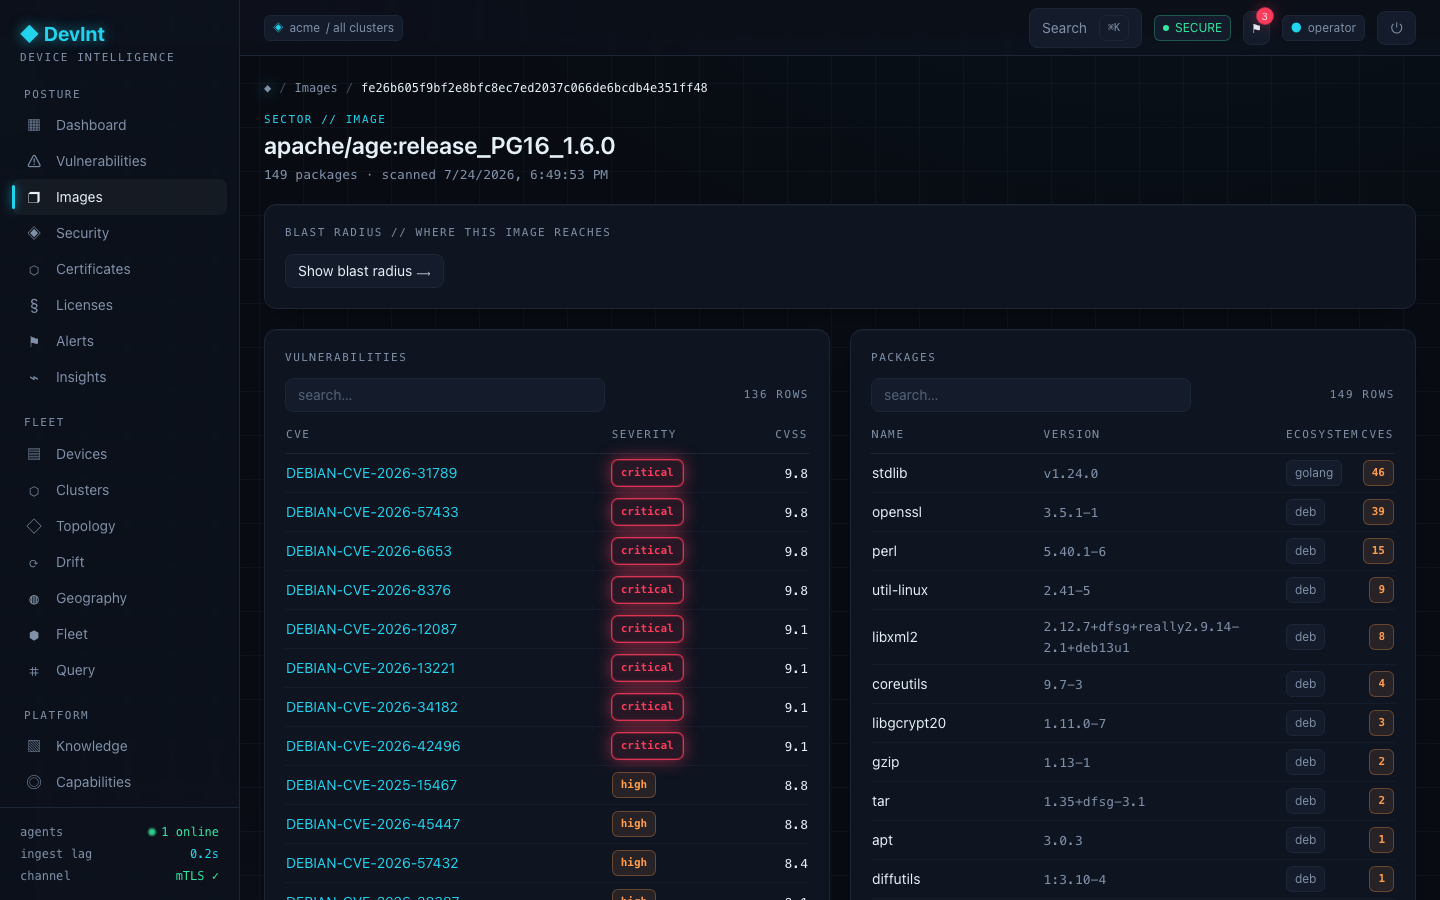
Open an image for its full package list and per-package CVEs, plus a blast-radius graph: every pod, node, and cluster that runs this image — so you see exactly what one vulnerable image reaches before you patch it.
Security
The read-only security findings the agents report: privilege-escalation surface, SSH hygiene, exposed ports, host posture, supply-chain tampering, and more. Each finding links to a runbook in Knowledge.
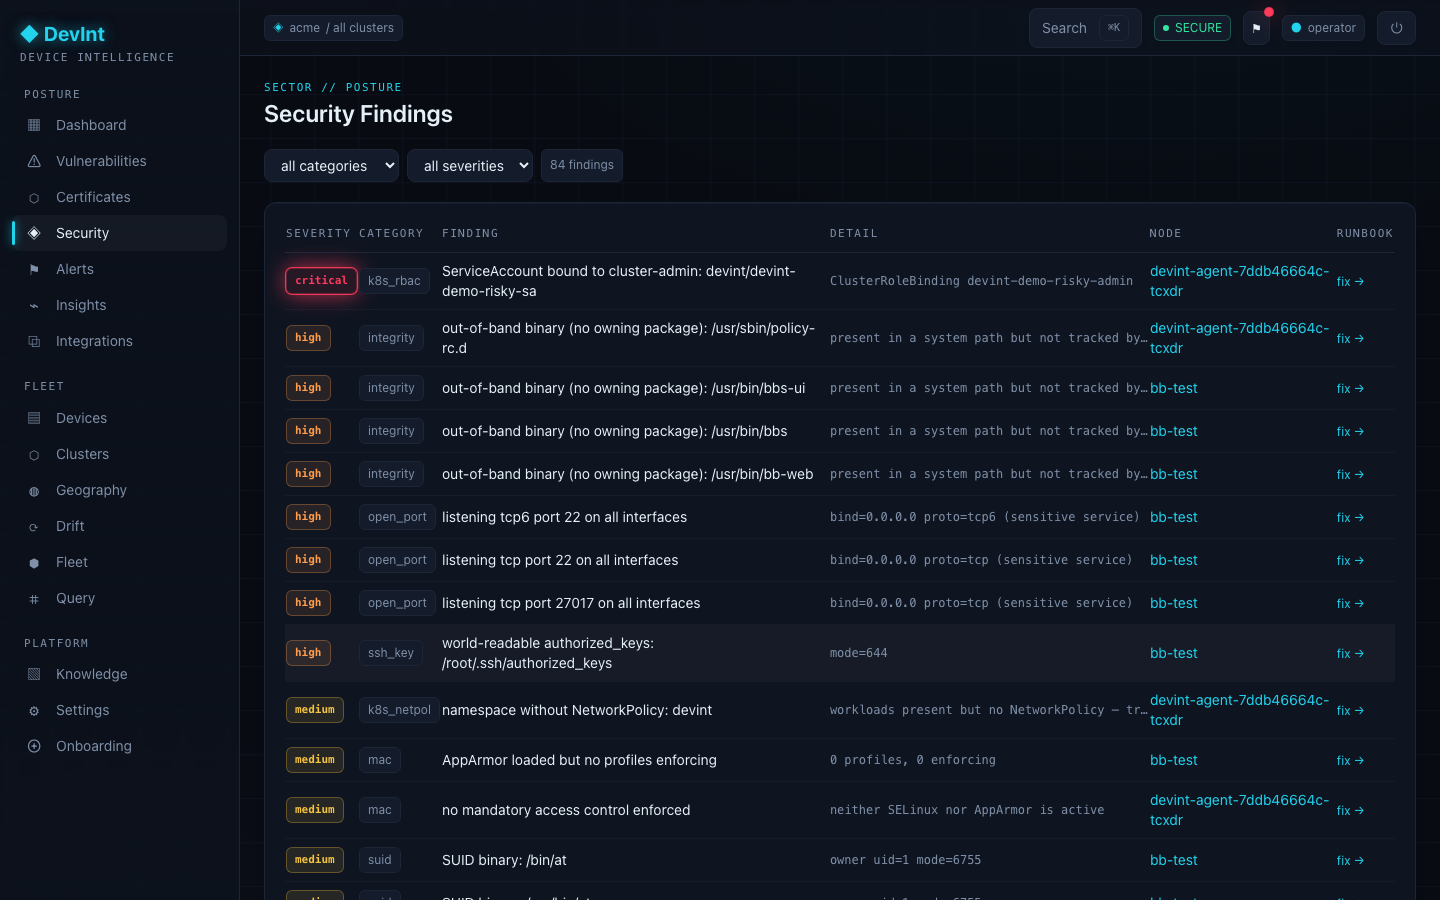
Finding categories map to collectors — see The agent & collectors for exactly what each one inspects. Severity is critical → info; findings are pruned automatically when the underlying issue is resolved on the next scan.
Alerts
Grouped, deduplicated alert instances with a full lifecycle. New high/critical findings and CVEs fire alerts routed by your rules to email and webhooks.
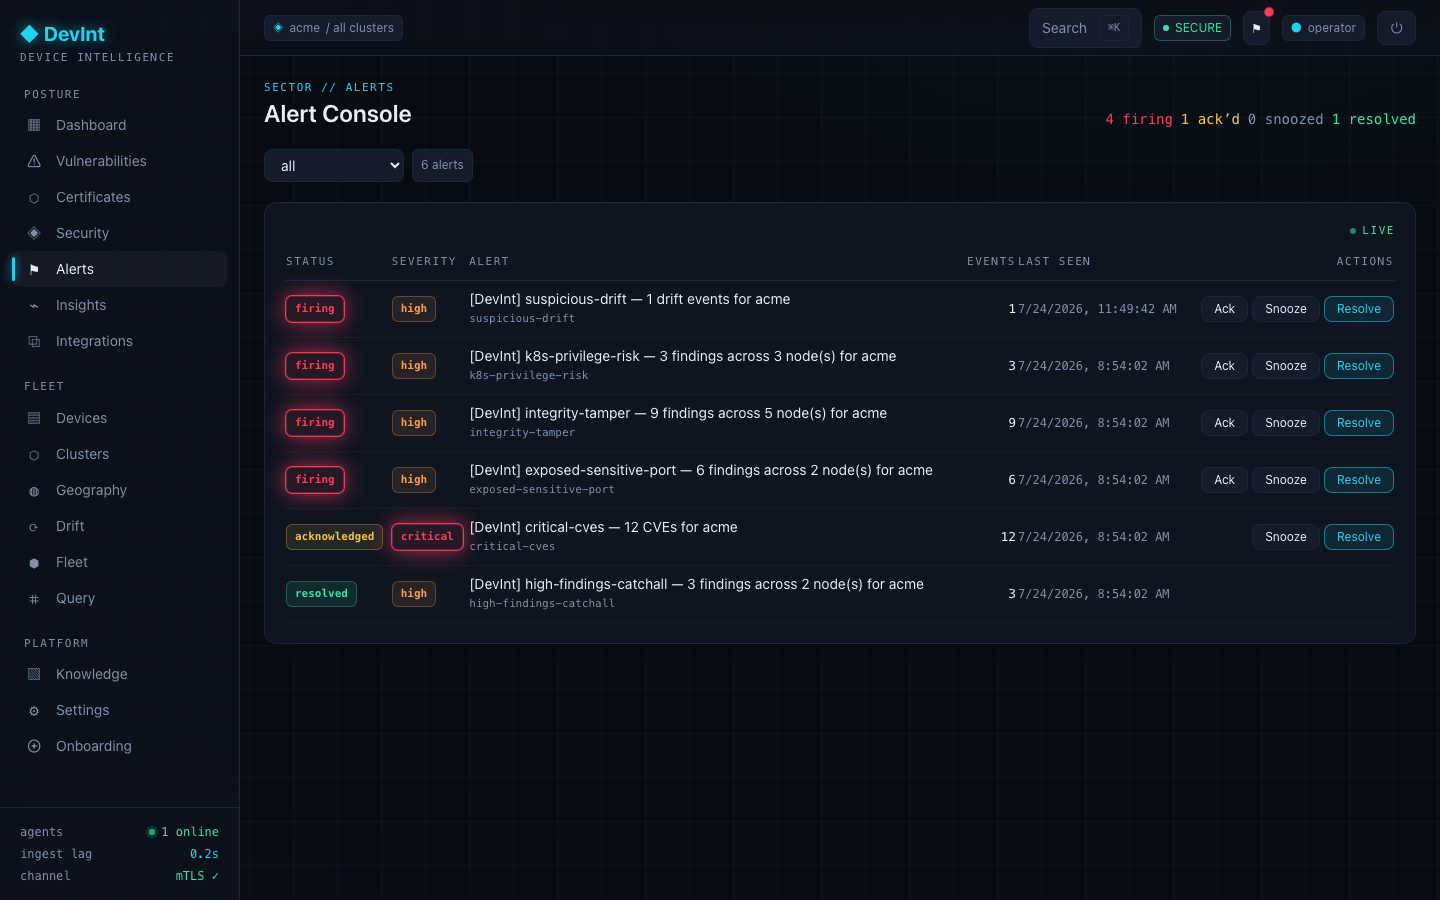
| State | Meaning |
|---|---|
| firing | Active and unhandled. |
| acknowledged | Someone owns it. |
| snoozed | Silenced temporarily. |
| resolved | Underlying condition cleared. |
Related events are grouped by fingerprint, so 12 CVEs from one rollout become one alert, not twelve pages.
Settings
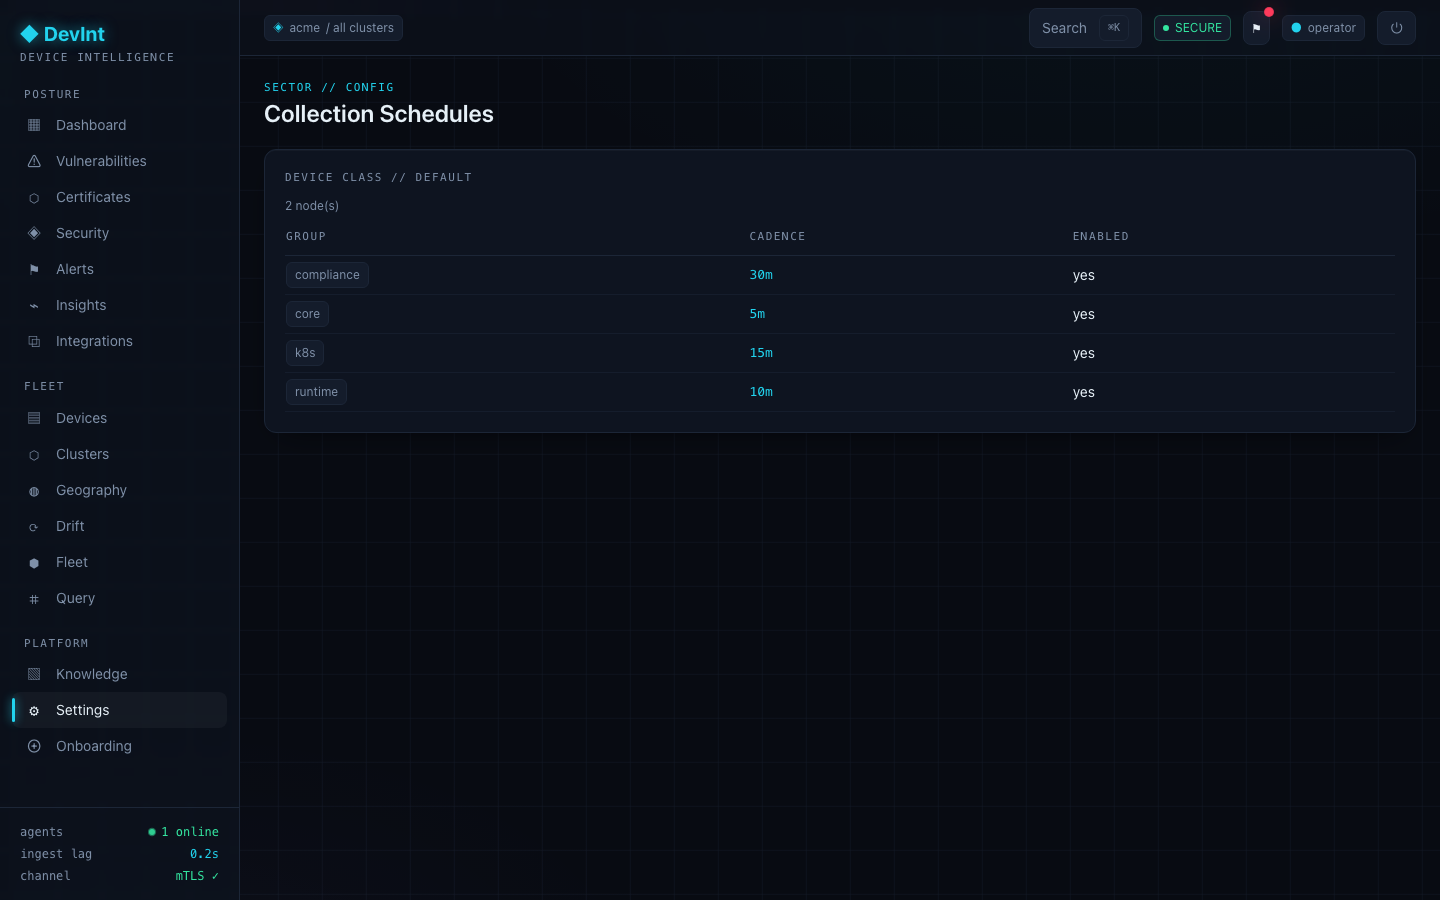
Collection schedules per device class. Each group of collectors (core, runtime, compliance, k8s) has its own cadence, pushed to the agent so it self-paces — you tune how often each layer is re-scanned.
Onboarding & tokens
Covered in full under Onboarding a node. This screen mints reusable enrollment tokens, lists all tokens with their validity and use counts, and lets you revoke any of them. Token management requires the admin role.
Updates
Which servers are behind, and on what. Counts come from the machine's own package index.
How to read it. Security is the number that matters — those are fixes published through the security suite. Reboot means the running kernel is not the newest installed one, so the patch is on disk but not in use.
apt-get update, or it is not a Debian-family system — the
counts show unknown and the server is excluded from alerting. Reporting zero for
something nobody measured would be the most dangerous thing this page could do.Services
Every systemd unit across the fleet, failures first. Defaults to showing only failures, so on a healthy fleet this page is deliberately empty.
How to read it. State is what systemd reports right now —
active, inactive, failed — not what is installed. A failed
unit also raises an alert.
Uptime
HTTP(S) checks against the endpoints you expose, every five minutes. The one place DevInt looks outwards: a server can be perfectly healthy while the service on it returns 500.
How to read it. State is up, degraded (responded, but not as expected) or down. TLS counts days until the certificate expires. Two consecutive failed checks are required before an endpoint is called down, so a single dropped packet does not page anyone.
Set Expect to the status the endpoint actually returns when healthy — a login page
typically answers 302, not 200.
Containers
Containers running on your hosts, read from the local Docker or Podman socket, alongside any Kubernetes workloads. Their images are scanned for CVEs and appear under Images.
--enable-containers. That grants the docker group, which is effectively
root, so it is opt-in. Without it this page is empty and says so.The agent & its collectors
The agent is a tiny read-only Rust binary. It runs a set of collectors, each reporting its coverage honestly as full, partial, or skipped. Collectors are organized into groups that can be scheduled independently (see Settings).
Core group — the inventory
| Collector | What it monitors |
|---|---|
pkg.dpkg | OS packages from the distro package database (Debian/Ubuntu dpkg): name, version, source. |
lang.deps | Language dependencies (e.g. Cargo and other ecosystems) with their resolved versions. |
certs | X.509 certificates on disk: subject, issuer, expiry, key bits, self-signed — fingerprints only, never keys. |
Runtime group — live privilege surface
| Collector | What it monitors |
|---|---|
sec.suid | SUID/SGID binaries, classified GTFOBins-exploitable vs expected-distro. |
sec.ssh | SSH key hygiene: weak keys (DSA, RSA<2048), world-readable authorized_keys, host keys — fingerprints only. |
sec.ports | Listening sockets parsed from /proc/net: wildcard binds, sensitive-port exposure. |
sec.sudoers | sudoers policy: risky NOPASSWD / wildcard rules. |
sec.caps | Linux file capabilities (security.capability xattr) that grant elevated power without SUID. |
net.iface | Network posture — interfaces, addresses, DNS resolvers, and gateways (context, not a finding). |
Compliance group — host posture & integrity
| Collector | What it monitors |
|---|---|
sec.integrity | Supply-chain tamper: out-of-band installs and dpkg md5 mismatches (a modified system binary). |
sec.users | Accounts DB: UID-0 duplicates and empty-password accounts. |
sec.mac | Mandatory-access-control status: SELinux / AppArmor present and enforcing. |
sec.writable | World-writable cron and systemd paths (a persistence / PATH-hijack vector). |
sec.audit | auditd presence — is the host even recording security events. |
sec.weakperm | Weak permissions on sensitive files. |
Kubernetes group — cluster attack surface
| Collector | What it monitors |
|---|---|
sec.k8s | Runs only in-cluster (ServiceAccount token present). Read-only queries of the K8s API for: over-broad ClusterRoles (wildcard verbs+resources), ServiceAccounts bound to cluster-admin, privileged/root pods, and namespaces without a NetworkPolicy. Also reports the cluster's identity (kube-system UID + version) so it becomes a first-class Cluster asset. Findings here belong to the cluster, not the pod. |
Data lifecycle & vulnerability detection
What happens to the data
- Emit. The agent assembles a CycloneDX 1.6 BOM (components + certs + findings as spec-compliant properties, no schema fork) and content-addresses it — so ingest volume scales with your change rate, not fleet size.
- Push. It sends the BOM (or just the delta) to the ingest gateway over mutual TLS. The client certificate carries the node and org identity, so a node can never write into another tenant.
- Normalize & store. The control plane deduplicates and writes the relational source of truth (PostgreSQL), the raw BOM (object store), a search index (OpenSearch), and enqueues graph projection.
- Project. An async worker builds the Apache AGE graph: nodes, components, certificates, findings, and the relationships between them —
HAS_COMPONENT,RUNS_ON(container→host),SERVES(node→cluster),AFFECTED_BY. - Query. The console routes each question to the cheapest store — a point lookup, an aggregation, or a graph traversal.
How posture aggregates
Counts roll up along the structures you browse: a cluster aggregates the findings of the nodes that serve it; a location aggregates everything in its subtree; a group aggregates convergence against its baseline. Every count is a live query, so drilling from a tile to the underlying set never goes stale.
How vulnerabilities are detected
- Match. Each component (by package URL) is matched against live CVE feeds — OSV.dev plus distro data — to find candidate CVEs. The same pipeline covers container images: every distinct image running in a cluster is inventoried by Trivy and matched identically, so image CVEs sit right beside host CVEs.
- Suppress false positives. DevInt separates version ordering from CVE fixed-ness. A distro backport (
-1ubuntu) can fix a CVE without bumping the upstream version — those are marked not affected via VEX, so you don't chase ghosts. - Prioritize. Confirmed affected CVEs carry CVSS severity, and any on CISA's Known-Exploited-Vulnerabilities catalog are flagged KEV — actively exploited, triage first.
- Alert on deltas. Newly-appearing critical/high CVEs and findings feed the alerting pipeline, grouped and routed by your rules.
Beyond CVEs — the other finding classes
The same data spine carries more than package CVEs, and they all land in one model:
- Read-only security findings from the host collectors above (Security) — priv-esc, SSH hygiene, exposed ports, supply-chain tamper — and the cluster collectors (RBAC, privileged pods, NetworkPolicy).
- Container-image CVEs from the Trivy scan of every observed image (Images).
- Certificate hygiene — expired, expiring, self-signed, and weak-key certificates, computed over the fleet's certificate inventory.
- Drift — what changed between two inventories, with fleet-relative attribution: a change unique to one node reads as manual/out-of-band, one spread across the fleet reads as an automated rollout, and an integrity mismatch is flagged suspicious (Drift).
- Third-party tool findings — an EDR/scanner's own detections, normalized alongside DevInt's, plus the coverage gaps where a tool should be reporting but isn't (Integrations).
DevInt operator documentation. The console is built on the same design system you see here. Questions a screen doesn't answer? Almost everything pivots — any entity opens to detail, any count opens to its filtered set.